MM2H Statistics
APPROVED MM2H VISA APPLICATIONS
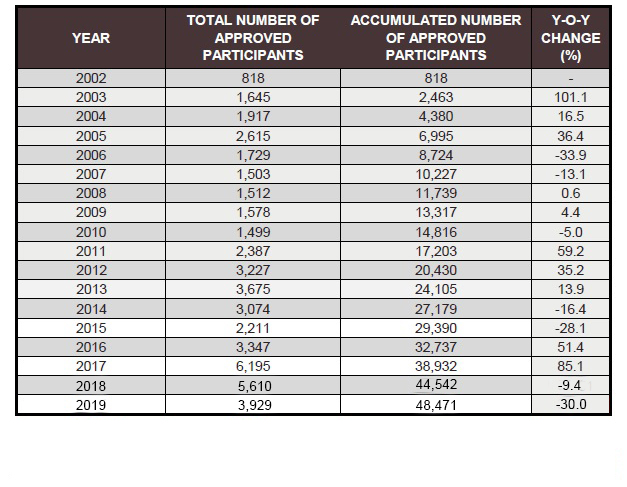
The figures below show the number of primary applicants approved. In many cases the applicants have spouses, and some come with children.
The information below comes from government sources. In 2019 many applicants were rejected for reasons which were never explained. In 2020 the programme was suspended and only commenced again in 2022. It is not clear if the immigration department who now run the programme will divulge the number of approved applicants but if they do, we will add the date on this page.
Although the Chinese have the highest number of approved visas it is believed only a few actually relocated here. Some applied because it was included with property purchases. It is particularly attractive to the Chinese because they do not qualify for visas on arrival. Most older Japanese like to take extended overseas holidays so many of them also applied as they wanted to be able to stay here for several months without any visa problems.
VISA INFORMATION BY COUNTRY
As of 2018 this was the mix of nationalities applying.
| CHINA (PRC) | 30.5 |
| JAPAN | 11.3 |
| BANGLADESH | 9.8 |
| UNITED KINGDOM | 6.4 |
| REP. OF KOREA | 5.6 |
| SINGAPORE | 3.5 |
| IRAN | 3.3 |
| TAIWAN | 3.3 |
| HONG KONG | 2.6 |
| INDIA | 2.5 |
| OTHERS | 21.3 |
| 100 |
APPROVED APPLICANTS BY YEAR 2002 TO 2019